")
As we start 2022, investors are encountering a surge in market volatility, manifesting in a sharp decline in our portfolio balances. Time to buckle up and endure another period of severe market volatility. The positive with corrections and volatility is that they create wonderful opportunities and should never be feared by those who have remained disciplined by investing in high quality businesses. To help our investors navigate through this turbulent period, we have provided the following insight into the market and portfolio strategies.
What has caused the market volatility?
The market correction has been driven by several catalysts.
But most importantly, inflation, as measured by the PCE Index (U.S. Personal Consumption Expenditures Core Price Index), has moved to 4.67% above the Federal Reserve’s target level of 2%.
What’s driving inflation?
It is a complex subject as it measures a lot of dependent and independent variables. While the global transition towards a greener future has created some structural issues for supply/demand dynamics in energy markets, most economists will agree that the Covid pandemic is widely responsible for the current surge in inflation.
Simply put, global lockdowns are very disruptive to supply chains and has had a worldwide impact. The combination of significant fiscal stimulus, shifting consumption habits related to stay at home mandates, labour mobility restrictions and severe staff shortages have manifested in higher prices for consumers. We expect these pressures to ease in the coming months as we emerge from the pandemic.
Following the Federal Reserve (the Fed) issuing the Federal Open Market Committee (FOMC) minutes early January, the prevailing market perception is that the Fed is likely to enact multiple rate hikes in 2022 to soften demand and combat these inflationary pressures. The Fed committee members are forecasting up to four rate rises in 2022, with longer term rates expected to cap out at 2.5%.
When considering the historical perspective, the cash rates should continue to remain low. However, a rise in rates does increase the cost of servicing the unprecedented debt levels in the system, leaving corporates and individuals with excessive debt vulnerable. And here in Australia, inflation remains within the Reserve Bank of Australia’s (RBA) target band of 2% – 3%.
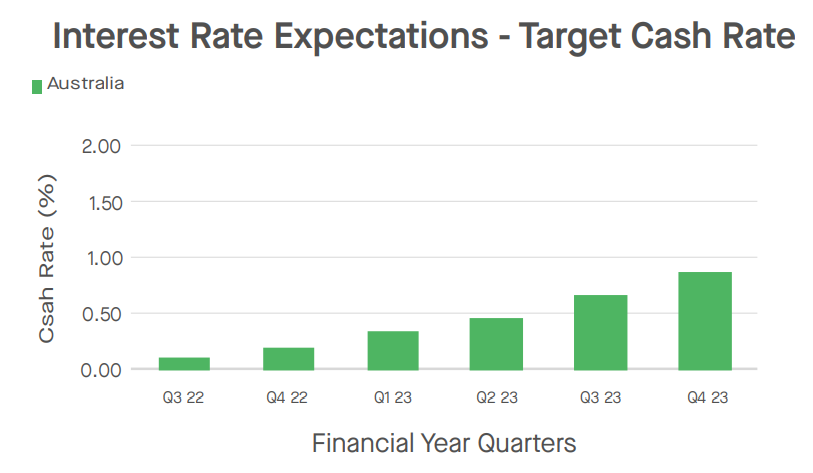
Source: Bloomberg
Interest rate forecasted in Australia to remain low for the medium to long term favouring equities.
Although current inflation figures are within the RBA’s target band, the factors driving inflation that have been discussed above could continue to push inflation measures higher in the coming months. As a result, some economists expect the RBA to lift the cash rate earlier than expected, forecasting a hike in the cash rate in August 2022.
What has this meant for stocks?
The broad signals for tightening monetary policy have typically coincided with growth stocks underperformance. Growth stocks share prices tend to be vulnerable to higher interest rates and inflation because they reduce the present value of future profits.
The below graph plots the MSCI Australia Growth, Quality, Yield and Value Indices. It demonstrates that there has been a sharp rotation from growth towards value and yield strategies over the last month.
Added to the ‘risk off’ migration from growth to value sentiment has been intensifying omicron waves and escalating geopolitical tensions between Russia and Ukraine.

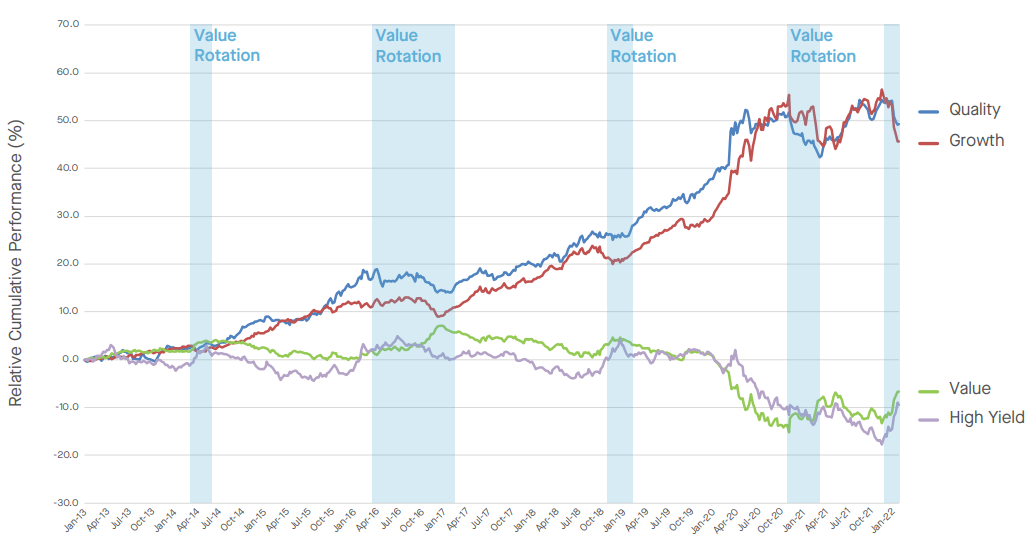
Source: Bloomberg
Sharp rotation from growth towards value and yield strategies over the last month
Flight to safety
The ‘risk off’ sentiment tends to trigger a flight to safety. ‘Safety’ in this context is generally perceived to be found in large cap defensive stocks. Many of Stock Doctor’s Star Income Stocks fall into this category as they tend to be mature businesses with a history of generating defensive earnings streams, reliable dividends and lower price volatility.
The charts below illustrate the ratio of large cap defensives vs small caps in both the U.S. and Australia. When the blue line is rising, this means that large caps are outperforming small caps and vice versa. The ‘flight to safety’ sentiment is illustrated during the most recent market corrections since 2018.
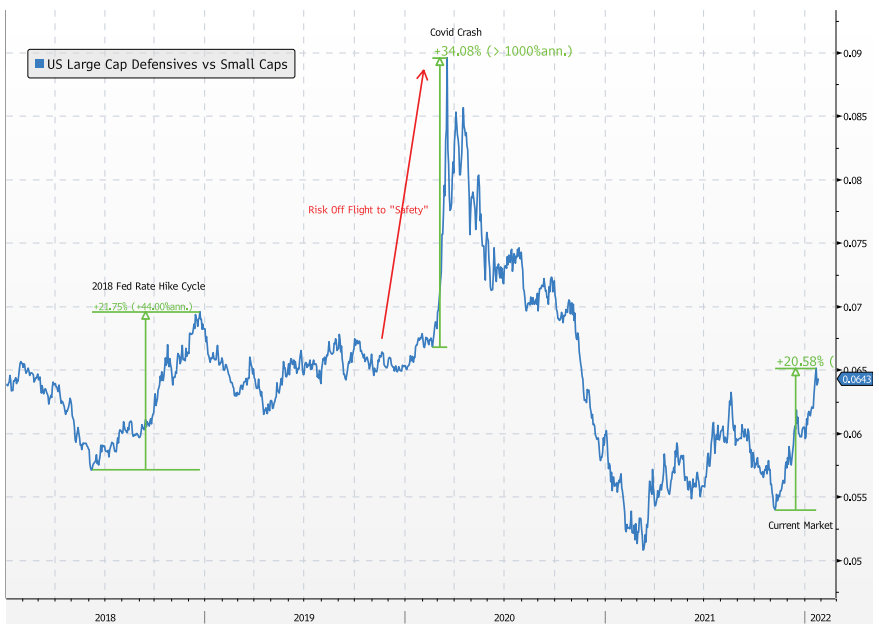
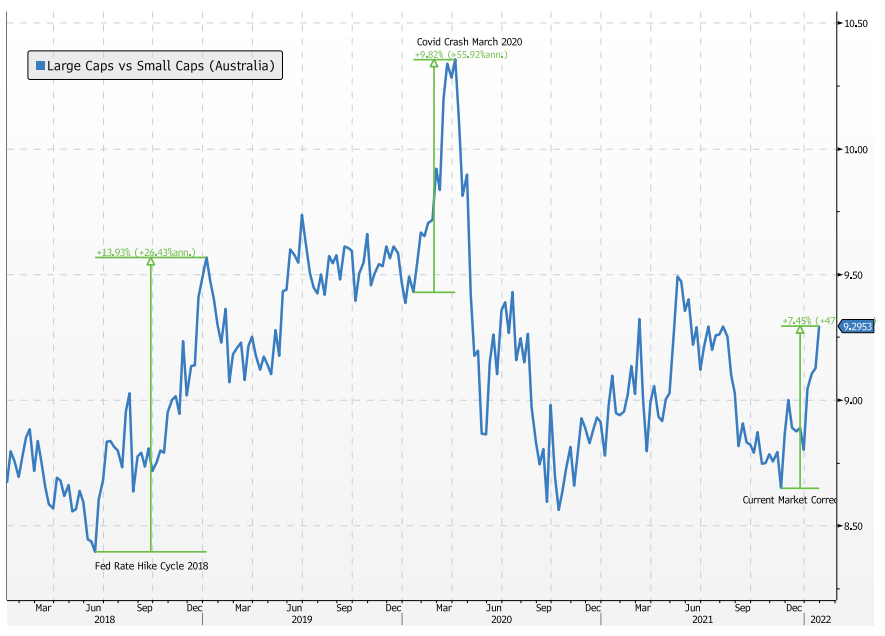
Source: Bloomberg
The ratio of large cap defensives vs small caps in both the U.S. and Australia.
Is the setup in today’s market like the Dot com bubble?
Our Senior Portfolio Manager – Managed Funds, Matthew Swartz believes in the adage, “history doesn’t repeat, but it often rhymes”. The dot com bubble reflected a period of excessive optimism, poor risk management and rampant speculation.
The internet was a game changer for productivity, and Wall Street clamoured hand over fist, providing capital to budding tech entrepreneurs. However, many of the businesses that floated in the 1990’s never reached profitability. The bubble eventually burst, and the U.S. market fell 78% from its peak in October 2002. Worryingly, we observe similar shades of irrational exuberance amongst today’s investors. You only need to look at the explosion of Cryptocurrencies, Non Fungible Tokens (NFTs) and “Meme Stock” Mania (GameStop, AMC) to discover that irrational behaviour is alive and well.
Fortunately, technology companies today are better placed than those of yesteryear.
The crucial differences are that, on aggregate, technology stocks are:
How long can the correction last?
Our Stock Doctor Head of Research, Kien Trinh, believes that “corrections tend to last only a month or two, but obviously, nothing is certain in equity markets”. He goes on to say that “instead of panicking, investors should take solace in the fact that we are not in unchartered waters.”
Growth stocks commonly experience corrections, and we should embrace the opportunity. Growth strategies in both the U.S. and Australia have experienced many corrections since the beginning of 2018. The pullbacks are often very sharp but mostly short lived. The U.S. Russell 3000 Growth Index has experienced a more than 10% drop on five separate occasions since 2018 until now; each time presented a good buying opportunity. The situation is similar here in Australia, with the basket of growth stocks also experiencing several pullbacks in recent years and each time recovering strongly.
Investors need to take the bad with the good
The market does not discriminate in sell offs. Great companies usually fall in line with weak ones. Learn to recognise opportunity and be prepared to take advantage of oversold, quality stocks.
The easy money cycle has ended. Equity markets have benefited from a 15 year long cycle of monetary stimulus. The tapering and eventual unwinding of monetary support and stimulus will mean more emphasis must be given to a company’s Financial Health. Businesses with excessive leverage and negative cash flow generation may struggle to survive in the new environment.
Reasons for optimism
Despite the volatility, economic growth remains robust and corporate earnings continue to expand.
The current earnings cycle has been driven by higher GDP growth, better asset quality, corporate balance sheet repair, and improved earnings margins. These factors are in stark contrast to the conditions presented during the dot com boom, where many tech companies rallied on management narratives rather than fundamentals.
The cause of supply chain issues such as temporary staffing issues, manufacturing shutdowns and high energy prices should normalise. This, in turn, should help ease inflationary pressures and support growth oriented companies.
Corporate earnings season in both the U.S. and Australia is upon us. We feel the market will be extra vigilant this period, seeking better clarity from management’s outlook statements.
What should investors do?*
When making investment decisions, consider your own personal circumstances. Every investor’s situation is different, from risk appetite to investment timeframe, and you should consider this before acting on any of the following.
Conditioned investors understand that volatility and share market corrections are an inevitable part of equities investing. Both the Australian and U.S. markets have been on a stellar run since the depths of the pandemic in March 2020, so it is only natural for the market to reset and normalise to a more realistic growth trend. Volatility should be embraced, not feared because it creates opportunities for savvy growth orientated investors.
Markets are unpredictable, especially in the short term. Still, investors need to separate the facts from the noise – knowing that good quality businesses with sound Financial Health and solid underlying fundamentals tend to deliver positive investor outcomes over the long run.
At Lincoln Indicators, we provide Stock Doctor for self directed investors and Self Managed Super Fund (SMSF) Trustees to access our exclusive quantitative research platform with essential portfolio manager and tracker tools – helping investors make confident decisions when selecting and constructing your stock market portfolio.
We also provide Managed Funds. Each fund has been developed by investing in the numbers – applying our quantitative methodology to invest in a portfolio of high-quality, financially healthy stocks. Whether you need a high-yield income stream, long-term capital growth or diversity outside Australia, we may have a managed fund to deliver on that goal.
Important: This communication is issued by Lincoln Indicators Pty Limited ABN 23 006 715 573 (Lincoln), as Corporate Authorised Representative of Lincoln Financial Group Pty Ltd ABN 70 609 751 966, AFSL 483167.
*This communication may contain general financial product advice or forward-looking statements regarding our intent, belief or current expectations with respect to market conditions. Readers are cautioned not to place undue reliance on these forward-looking statements, as our advice has been prepared without taking account of your personal circumstances. You should therefore consider its appropriateness, in light of your objectives, financial situation and needs, before acting on it. Please refer to our Financial Services Guide (FSG). If our advice relates to the acquisition or possible acquisition of a particular financial product, you should obtain a copy of and consider the Product Disclosure Statement (PDS) for the product at https://www.lincolnindicators.com.au/ before making any decision. All figures, information and illustrations are as of 27 January 2022 unless stated otherwise.
Copyright © 2022 Lincoln Indicators Pty Ltd. All rights reserved.
To discuss the future of your investments in detail, book in a free consultation with a Lincoln representative.
To discuss the future of your investments in detail, book in a free consultation with a Lincoln financial expert.