
The pivotal shift in monetary stance by central banks around the globe caught many by surprise and was a consequence of inflationary pressures and supply chain disruptions from the after-effects of the unprecedented stimulatory response during the COVID-19 pandemic.
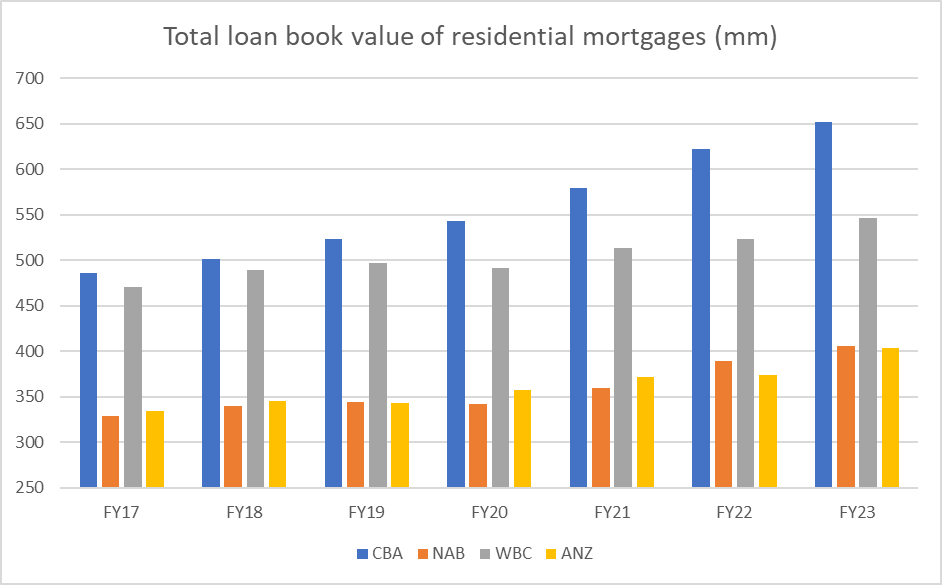
By far, one of the handful of sectors whose earnings were direct beneficiaries of rising rates was the banking industry. In the last few years, banks had built up record high loan books, facilitated by elevated mortgage credit demand from low interest rates, and this has allowed them to benefit from net interest margin expansion driven by rising rates.
Source: Stock Doctor, Visible Alpha
The core of a bank’s profitability comes from its net interest revenue – which represents the margin the bank charges on its loans compared to the cost it pays out in deposits and other funding sources. Higher cash rates lead to increased lending rates across all products, with the immediate pass through to variable loan rates. By raising lending rates first and delaying the increase in deposit rates, banks can lift their net interest margins. In addition, whilst banks use “replicating portfolios” to help them hedge against interest rate movements, rising interest rates can lead to gains within these government bond portfolios.
Lastly, when interest rates are rising, customers tend to choose variable rates because the rate on fixed rate loans are higher. Despite this, variable rates tend to have fatter margins and the demand contributes to the stronger profitability.
In FY23, rising interest rates and bank profitability led to increasing dividends and the outperformance of the banking sector relative to the market. Nonetheless, all good things must come to an end.
For the month of October, consumer price index (CPI) prints in both Australia and the United States highlighted a moderation in year-on-year inflation rate, with the initial US CPI print tracking below consensus expectations.
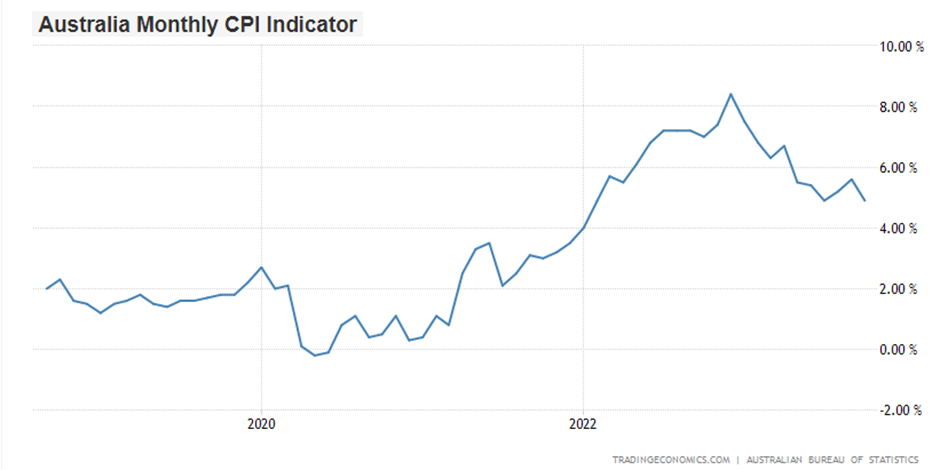
Source: Trading Economics
With emerging signs that inflation may be trending back to the central banks’ target range of ~2-3%, future interest rate expectations have also been tempered and revised lower. This is shown by the dip in the 10-year US treasury Index (RHS: yield) over the month of October 2023.
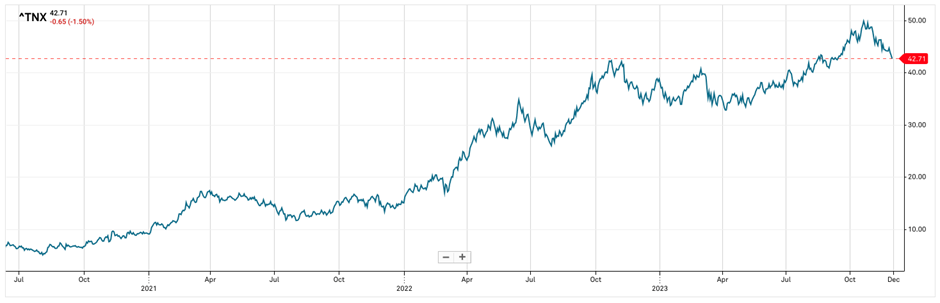
Source: S&P Capital IQ
Coinciding with the softer CPI data was the release of the FY23 results for the three banking majors – ANZ, NAB and Westpac, along with a 1Q24 quarter update from Commonwealth Bank.
Given the softening outlook for rate rises in the near-term and intense competition across mortgages we have begun to see pressure on net interest margins in the 2H23. Additionally, persistent cost inflation (wages, technology investment) have led to negative earnings revisions across the bank sector since the start of the year. Hence, we believe it will be difficult for banks to outperform the market in the year ahead.
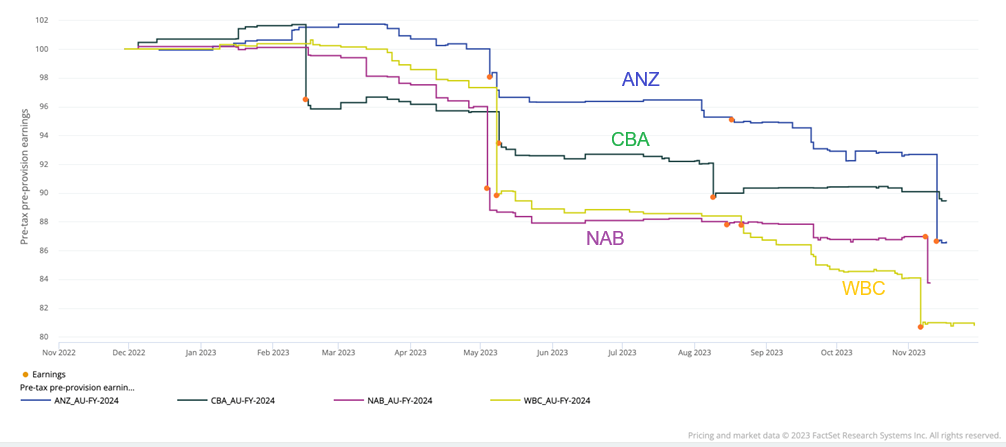
Major bank earnings expectations over the last year.
Source: Visible Alpha
We have ranked the four majors following their results across metrics such as 1) active risks (i.e. earnings susceptible to downgrades), 2) level of exposure to residential mortgages, business (i.e. SME) or institutional lending, and 3) asset quality of their respective loan books (ie. bad debts).
By all accounts, asset quality across all four majors appear sound despite a slight pick-up in delinquencies, as banks have been shoring up their provisional balances (buffer against potential loan write-offs) in anticipation for an elevation in credit risks due to deteriorating economic conditions.
From an earnings perspective, we view NAB and CBA more favourably due to their greater and growing proportional exposure towards the business lending space. This is also reflected in Stock Doctor, with CBA and NAB displaying the strongest earnings revisions over the last three months.
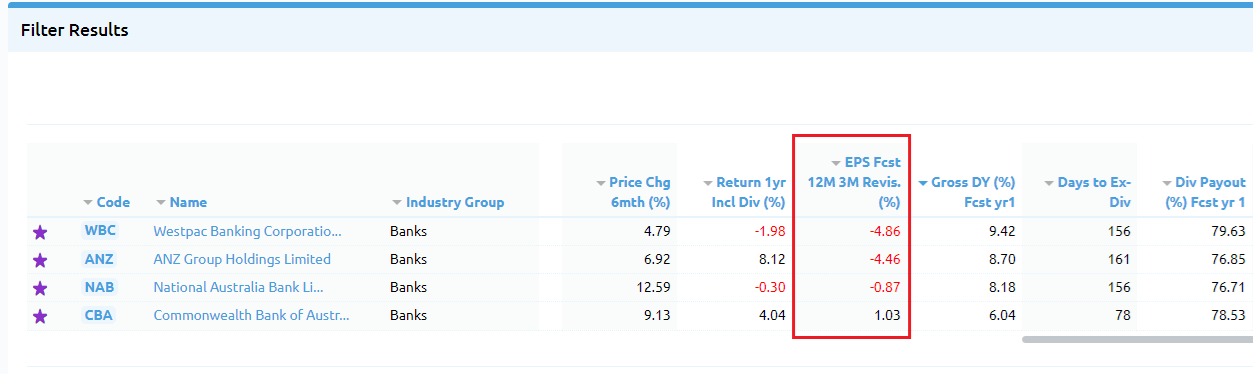
Source: Stock Doctor
Unlike the residential mortgage market wherein competition is rife, particularly due to recent entrants such as non-bank lenders like Australian Financial Group (ASX:AFG) or Resimac (ASX:RMC), business lending benefits from lower competition and therefore, is characterised with net interest margins that is >50% greater than that of residential mortgages.
On the other hand, the active risks are perceived to be greater for Westpac and ANZ, as both banks are rather late in the digital transformational cycle (when compared to NAB & CBA) and/or have more technological integration work to complete from prior/pending acquisition(s).
Due to substantially higher tech-related wages, software or third-party vendor costs (vs peers), Westpac and ANZ remain more susceptible to inflationary pressures within their cost bases, and consequently, both earnings (and dividends) are at greater risk of downgrades. For WBC, the business is still trying to absorb the integration of previous acquisitions including of St George and Bank of Melbourne. Meanwhile, ANZ could face significant integration costs if the merger with Suncorp goes through.
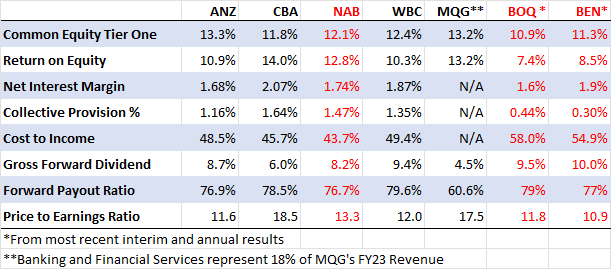
For the FY23, the major banks were all able to increase dividend payments, with growth ranging from 4% (NAB) to 13% (ANZ). All banks are financially healthy and well capitalised with their common equity tier one ratio well above regulatory requirements. In fact, both WBC and NAB underwent a share buyback while ANZ paid a special unfranked dividend of 13cps. The table below compares the banks across some of the key performance metrics. Note that both CBA and NAB have the higher ROE among the four majors.
Source: Stock Doctor, Financial Statements
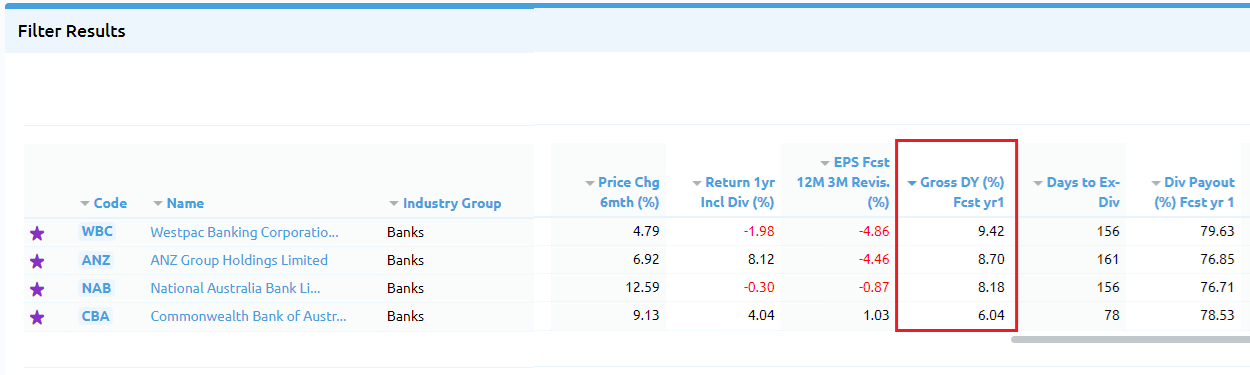
Within Stock Doctor, to compare the banks, you can refer to the peer comparison table within the 9GR page when a bank is selected, or you can click on the Star Income Stocks portfolio under the watchlist or stock filter and sort the companies by industry group. Currently Westpac and ANZ appear to have the most attractive forecast gross dividend yields at 9.4% and 8.7% respectively however, investors will need to be mindful that the market is pricing in higher risks of earnings downgrades and possibly dividend cuts across these banks.
Source: Stock Doctor
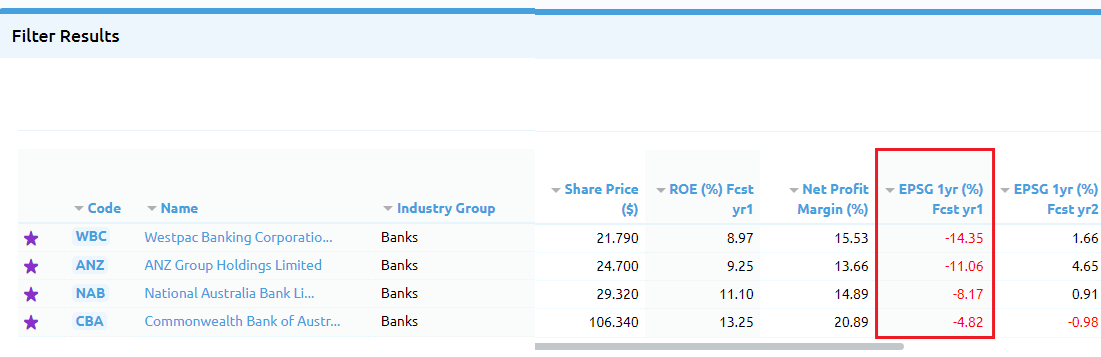
Although the forecast dividends appear attractive, the high dividend yields in the bank sector are currently pricing in the potential for an economic contraction in the year ahead, as highlighted with the negative earnings growth expectations below. This could put pressure on dividend expectations and lead to higher payout ratios. Note also that earnings for both WBC and ANZ are forecast to fall more substantially than for NAB and CBA. Hence, from dividend sustainability perspective, we prefer CBA and NAB over ANZ and WBC.
Source: Stock Doctor
The bank sector faces major headwinds in the year ahead on the back of slowing economic growth, intense competition for residential lending, and a potential peak in interest rates removing the tailwind on net interest margins. This would ultimately weigh on capital gains and dividend expectations. Hence:
To discuss the future of your investments in detail, book in a free consultation with a Lincoln representative.
To discuss the future of your investments in detail, book in a free consultation with a Lincoln financial expert.


