
Had you foreseen last year’s COVID-led share market crash, would you have exited the market, sold your shares and gone to cash? By selling in February 2020, you could have avoided the ASX’s sharpest 30 per cent-plus fall on record.
If you could simply sidestep this and any other dips in the market, why wouldn’t you?
Yet, perhaps puzzlingly, even if you had a crystal ball and knew that the market was set to take a dive, exiting the market may not have been the wisest decision.
History tells us that even in hindsight, timing the market and exiting your position ahead of a correction rarely pays off. If you were to only hold stocks when they were rising, over the long term you’d fail to outperform your peers that stick through sharp falls.
That may sound counterintuitive, but there are a number of reasons for this.
By selling your investments at any suggestion of a market correction, your long term returns are likely to be diminished. Much of this is because by sitting in cash, waiting for a pullback, there’s a good chance that you’ll miss some of the market’s best performing days — a factor that can be disastrous to your portfolio returns.
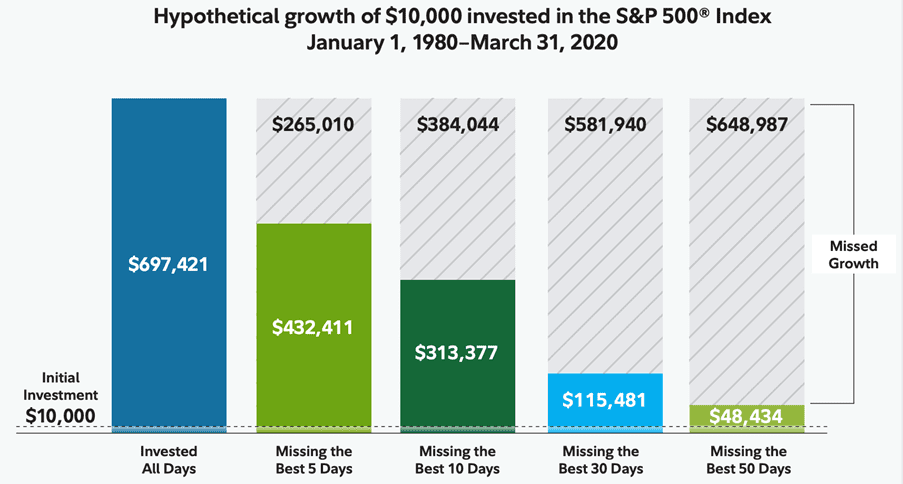
As you can see in the chart below, had you invested $10,000 in the S&P 500 Index in 1980, it would be worth almost $700,000 by March 2020. But if you were out of the market during the five best performing days, your return would be worth just $432,000.
If you were out of the market for the best 50 days over that 20 year period, your portfolio would be worth a measly $48,000. That’s just 7% of the potential return from remaining invested throughout the ups and downs over the years.
 Source: Fidelity, S&P500
Waiting in cash ahead of an anticipated pullback heightens the chance that you’ll be out of the market during its best performing days since the best performing days tend to pre-empt periods of sharp decline.
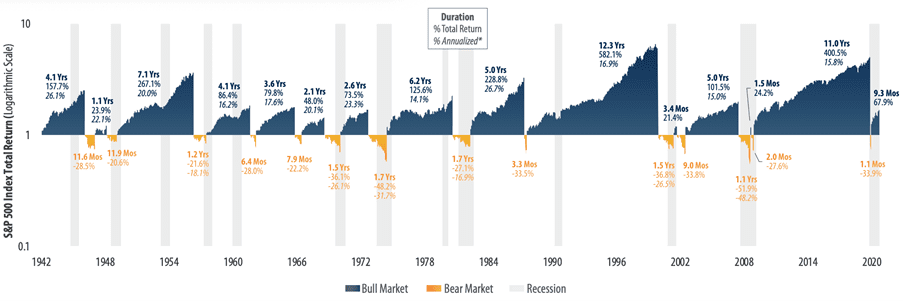
This strength leading into a correction can be seen in the chart below which outlines historical performance of the S&P 500 Index throughout the U.S. bull and bear markets since 1942.
 Source: www.ftportfolios.com
Just as it is difficult to time peaks, it’s also very hard to pinpoint the market bottom or know whether the downtrend will continue. Investors that try to do so, or who simply panic after the market is sold off in fear it has further to fall, may miss the opportunity to recover their losses as markets also tend to rally hard in the early days of a recovery.
Another takeaway from the above chart is the sharp contrast between the time that the market (as represented by the S&P 500 Index) has spent in bull versus bear territory since 1942. Over that period, being invested in the market has almost always been a better bet than sitting on the sidelines.
So while the media love to push headline grabbing doom and gloom stories, bear markets are actually rather rare. Since 1942, the average S&P 500 bull market lasted 4.4 years, averaging a total return of 152.6%. The average bear market, on the other hand, lasted less than a year, at just 11.3 months with an average total loss of 32.1%.
Staying invested through the market’s swings gives you the best chance of meeting your goals and achieving long term investment success.
In addition to missing the chance to be invested in rising shares, we must also consider that when out of the market you’re also losing out on the massive benefits of compound interest. Compound interest involves reinvesting your returns, so you’re earning interest on interest. It is a key factor in growing your portfolio exponentially over multiple years, but the process is interrupted every time you sell your shares and retreat to cash.
When you’re out of the market, you also miss out on the chance to reinvest dividends and make regular investments at lower prices. This too has negative long term consequences on portfolio returns.
Whether optimal or not, we must also consider whether accurately timing the market is even possible.
Predicting market declines is notoriously difficult, and to do so, time and again with any consistency, is near impossible. Investors can be their own worst enemy. Under pressure, their behaviour often fails to match their plan — fear, greed, or even overconfidence can take hold and override their strategy (if they had one to begin with). Plus, many of the market’s largest drops have been in response to unpredictable Black Swan events, such as the COVID-19 pandemic.

Even for the world’s most highly regarded economists, predicting market peaks is a difficult task. Take, for example, NYU professor and former White House senior economist Nouriel Roubini. Roubini is widely credited for having accurately predicted the GFC that saw the U.S. market lose more than half of its value between October 2007 and March 2009.
What isn’t so well publicised, is that Roubini — like other expert market commentators who foresaw the GFC — has over the years made numerous incorrect calls of impending market crashes, earning him the moniker Dr Doom for his frequently pessimistic outlook. It’s true that if you say something enough, you’re bound to be right on occasion.
Let’s now assume that you are able to time the market to perfection: selling ahead of pullbacks and buying back in once a stock has resumed its long-term upward trend.
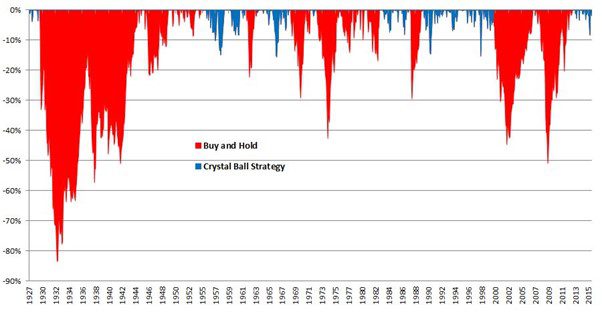
In this example, Michael Batnick of Ritholtz Wealth Management compared a buy and hold strategy versus exiting ahead of every bear market in the S&P 500 Index between 1927 and 2015 — “crystal ball strategy”. Assuming that ahead of every 20% pullback in the S&P 500, you sell at the peak and go to cash, waiting for a recovery. Once it rebounds back to the level that you sold and you’re comfortable it is again trending higher, you buy back in — avoiding the bear market.
S&P 500 declines 1927-2015 using a crystal ball strategy versus buy and hold:
 Source: theirrelevantinvestor.com
Yet even with the foresight to avoid every 20% decline, you would still come out ahead with a buy and hold, or ‘time in the market’, strategy. Under the buy and hold strategy, investing $100 in 1927 would result in $360,856 by 2015. But by timing the market and avoiding each decline of 20% or greater, you would end up with just $130,523. This is because during the time you are out of the market, you lose the chance to leverage dividends, compound interest, and time.

Source: theirrelevantinvestor.com
‘Time in the market’ doesn’t try to guess when the market is at its lowest or highest point. Instead, the investor accepts that their timing is not perfect, but also knows that remaining invested pays off in the long run. The investor will stick with the investment through the highs and lows until the initial reasons for buying change or they’ve reached their intended goal.
With history backing us, we have every reason to believe that the share market will continue to rise for years to come, so rather than trying to time your entry and exits levels, hold your nerve and remain invested.
Market timing strategies have overwhelmingly shown not to work — it’s impossible for even the best of the investors and analysts to consistently predict markets’ tops and bottoms. Attempting to do so can have large negative impact on long term portfolio returns.
Investing consistently in a disciplined manner with a long-term investment mindset is the optimum way to create wealth from stock markets.
But to be clear, staying clear of trying to time the market does not mean avoiding individual stock picking. The best way to profit from investing in the share market is to make sure that you are invested in the right shares — quality, financially healthy businesses that can stand the test of time. And if their circumstances change, particularly in regard to their financial health, investors must be prepared to sell.
One way to identify fundamentally sound, quality income and growth stocks is with Stock Doctor, which utilises Lincoln’s Financial Health model to identify Star Growth and Income Stocks. The platform also provides all the tools for you scan the market and identify those companies that meet your requirements and investment goals.

Stock Doctor Star Growth and Income Stocks since inception
The information in this communication is market commentary only and reflects Lincoln’s views and beliefs at the time of preparation, which are subject to change without notice. To obtain up-to-date information, please contact us.
To discuss the future of your investments in detail, book in a free consultation with a Lincoln representative.
To discuss the future of your investments in detail, book in a free consultation with a Lincoln financial expert.


