Most investors understand the merits of asset diversification, but did you know keeping your investments limited to one market could be detrimental to long-term performance?
Australia is a relatively small, highly concentrated market when you compare it to the global stage. It only takes setbacks in two sectors, banks and resources, for investors to feel the squeeze on their income and capital growth. Case in point, the recent COVID-19 correction, which saw a vast number of high yielding stocks, primarily the banks, slash or defer dividend payments.
Currently, the ‘big 4’ banks make up ~20% of the market capitalisation of the ASX 200 and combined with resources, this increases to ~40%*. So, whilst you might feel you have ticked the boxes in terms of sector diversification, spreading your investment wings into new geographies can reduce your overall risk. *As at 15 June 2020
When considering overseas investment markets, the U.S. market is like no other in terms of scale and diversity. It provides the opportunity to invest in companies that are at the cutting edge of technology, manufacturing and science, many of which are not represented in Australia.
Here are 5 key reasons why you should consider allocating a portion of your investment portfolio to U.S. equities.
The performance of U.S. companies isn’t just limited to the health and growth of the U.S. economy. The S&P 500 index is much more global with many U.S. corporations having an international presence, deriving assets and revenue from foreign markets.
At a country level, nearly 61% of S&P 500 revenue comes from the U.S., with the remaining coming from foreign markets. Internationally, the largest individual countries by total revenue include China (5.9%), Japan (3.1%), and the UK (2.5%).
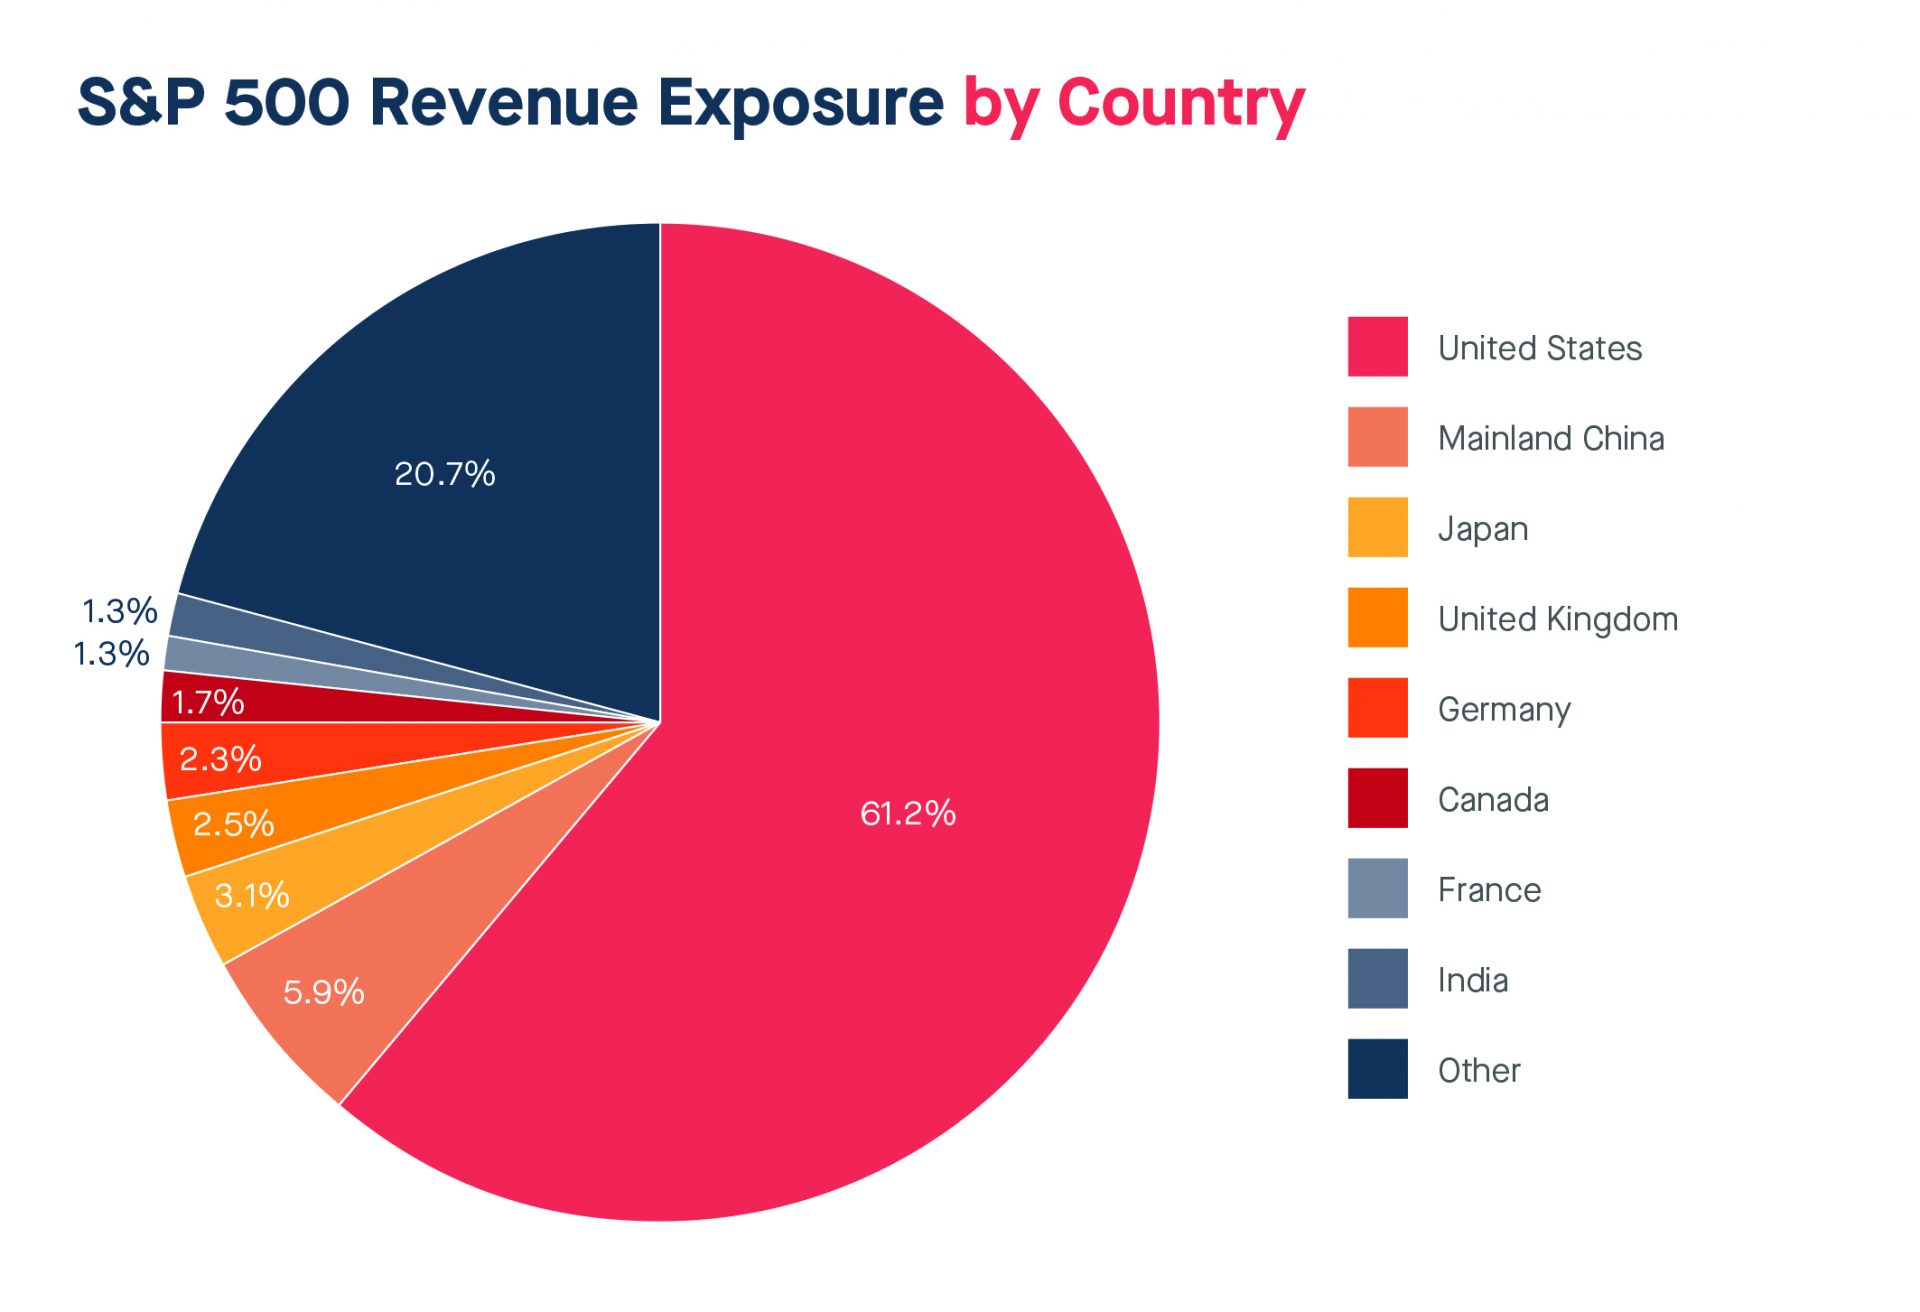
Source: FactSet. Data as at 18 June 2020
Whether you are looking for fast-moving and rapid-rising technology companies or steady-growth players, the U.S. market has a deep pool of companies and industries that can enhance your investment portfolio.
As the world’s largest economy, the United States is home to the biggest stock exchanges in terms of the number of listed companies and market capitalisation.
Did you know over 50% of the world’s stock market capitalisation comes from the U.S.? The chart below illustrates just how large the market is in comparison to the rest of the world.
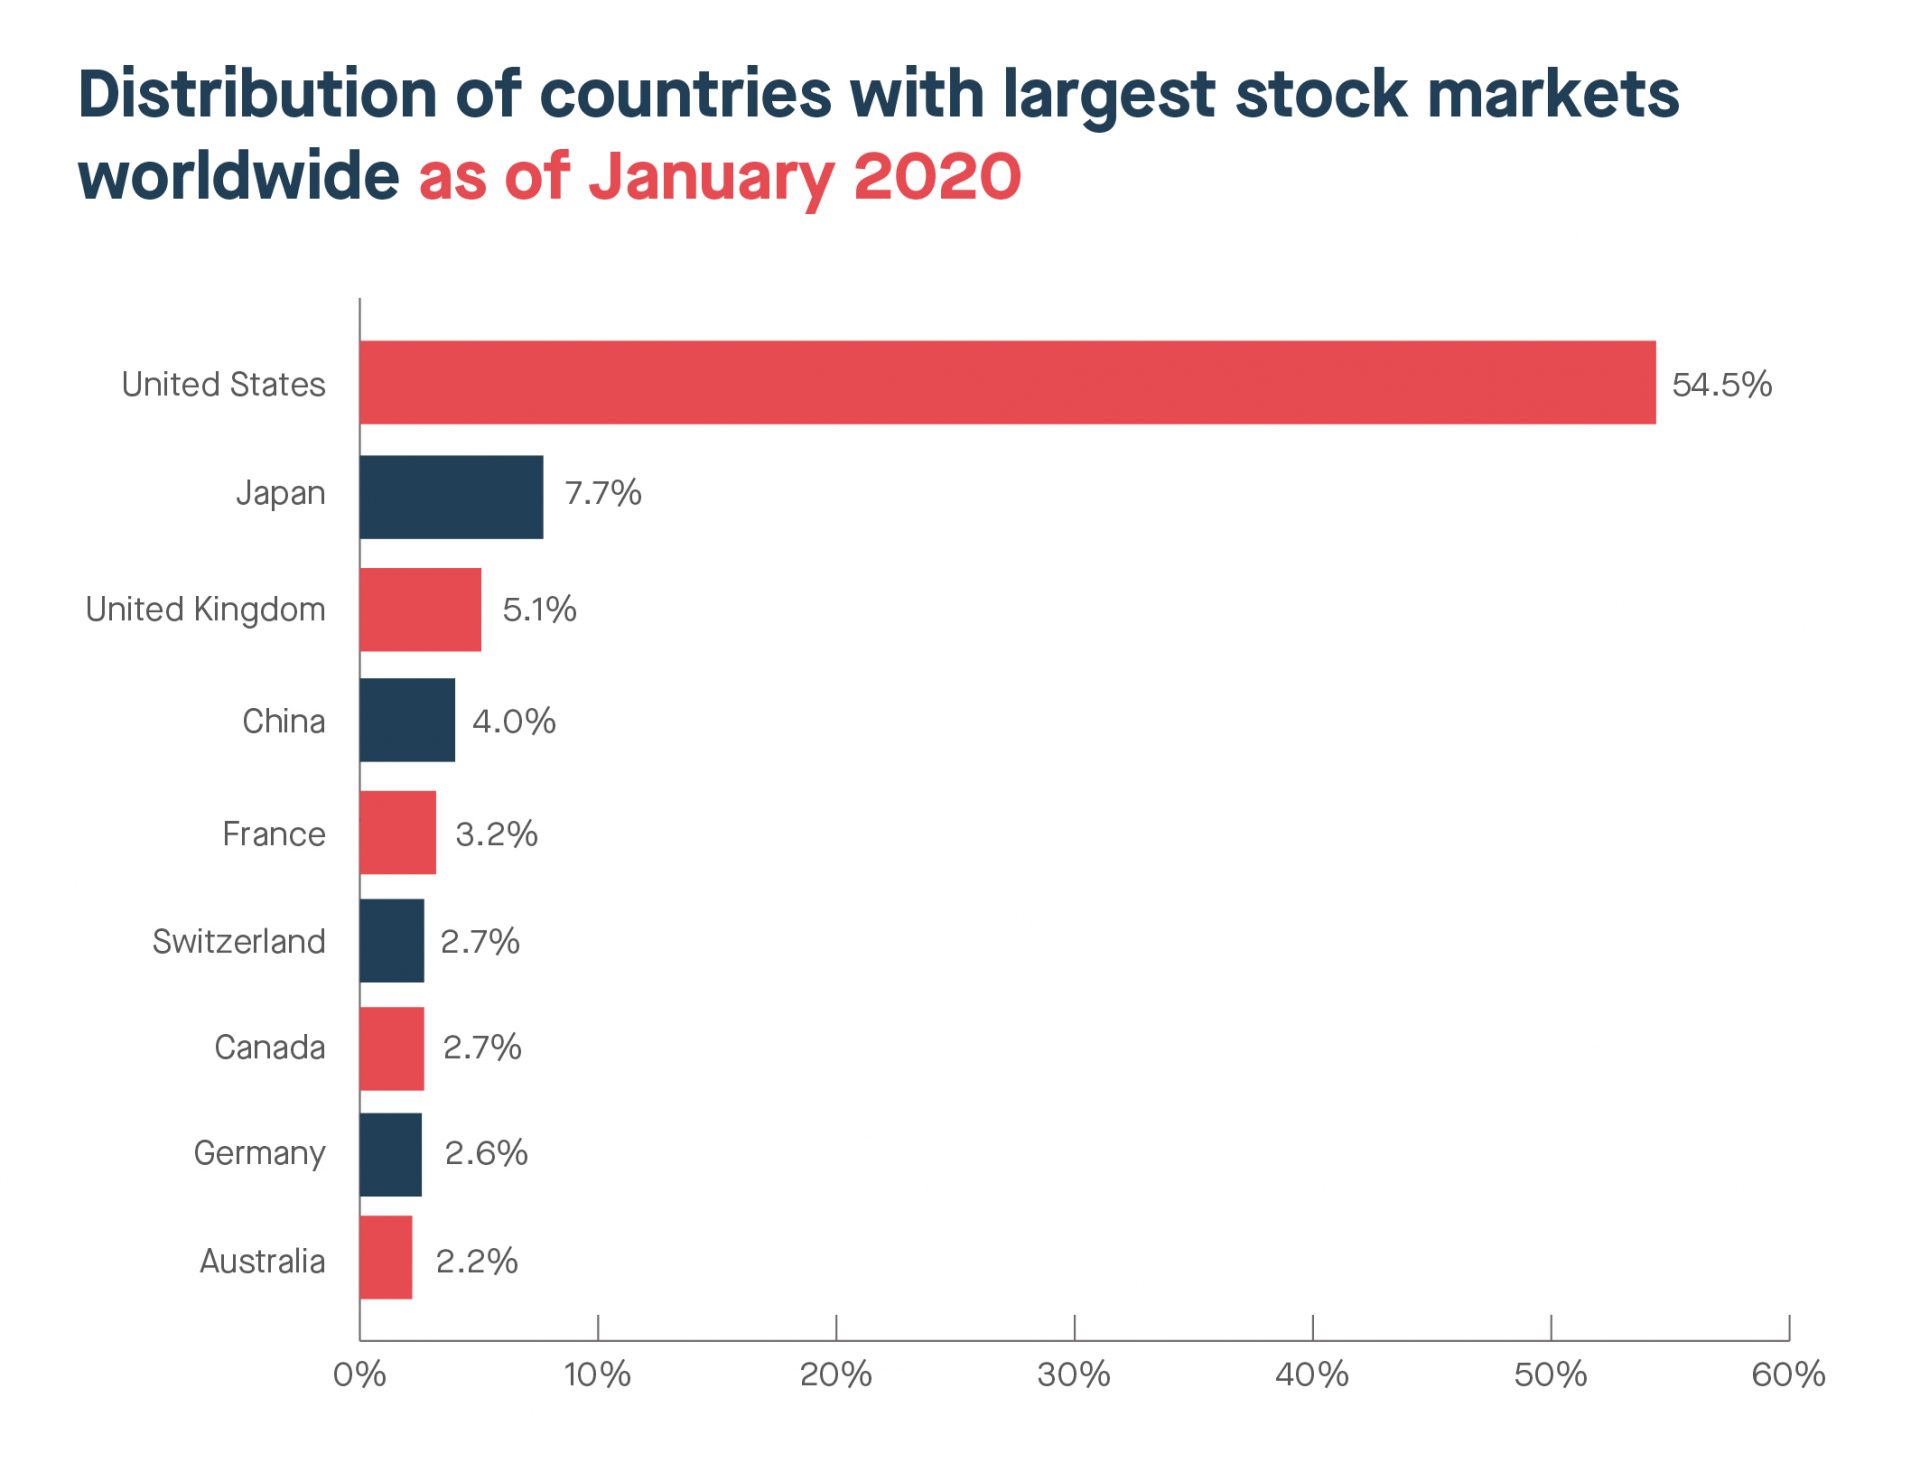
Source: Statista
The fact that the U.S. hosts many of the world’s largest companies, also means its stock markets have deep liquidity, resulting in opportunities to invest in a wide range of industries. With the significant number of new products and services to market generated in the US, it attracts a constant flow of investment money from across the globe.
According to the latest statistics from the World Bank, nearly U.S.$23 trillion worth of trades went through the U.S. stock exchange in 2019.
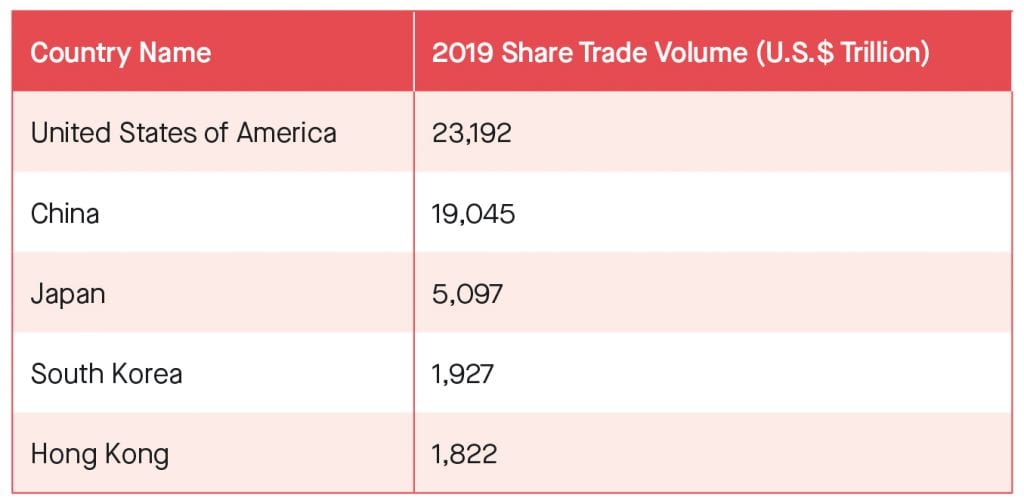
Source: World Bank.
Put simply, the acronym FAANG represents five stocks which are Facebook, Amazon, Apple, Netflix and Google. Traded on the NASDAQ, investors turn to technology companies when they are looking to invest in growth stocks and a large number of investors’ portfolios are concentrated in the FAANG’s.
These companies have changed the way we live and have reshaped the world whether it comes to how we purchase goods and services, how we watch movies and play video games and even communicate with our family and friends.
The members of FAANG are so massive and profitable that they generate a significant amount of the Gross Domestic Product (GDP) in the U.S. They currently have a market capitalization of around U.S.$ 3.9 trillion and they make up ~15%^ of the total value of the S&P 500.
Investing in the U.S. market puts you in pole position to take advantage of not only the revenue derived from the FAANGs but also upcoming leaders in technology and innovation.
^Source: IRESS. Data as at 15 June 2020.
Over the past 10 years to 30 May 2020, the average annual return from the U.S. market (Hedged) was 13.15% p.a. and U.S. market (Unhedged) was 15.88% p.a. versus 7.25% p.a. from the Australian market. On an annualised basis, this difference when compounding over several years makes the U.S. market an attractive option for Australian investors.
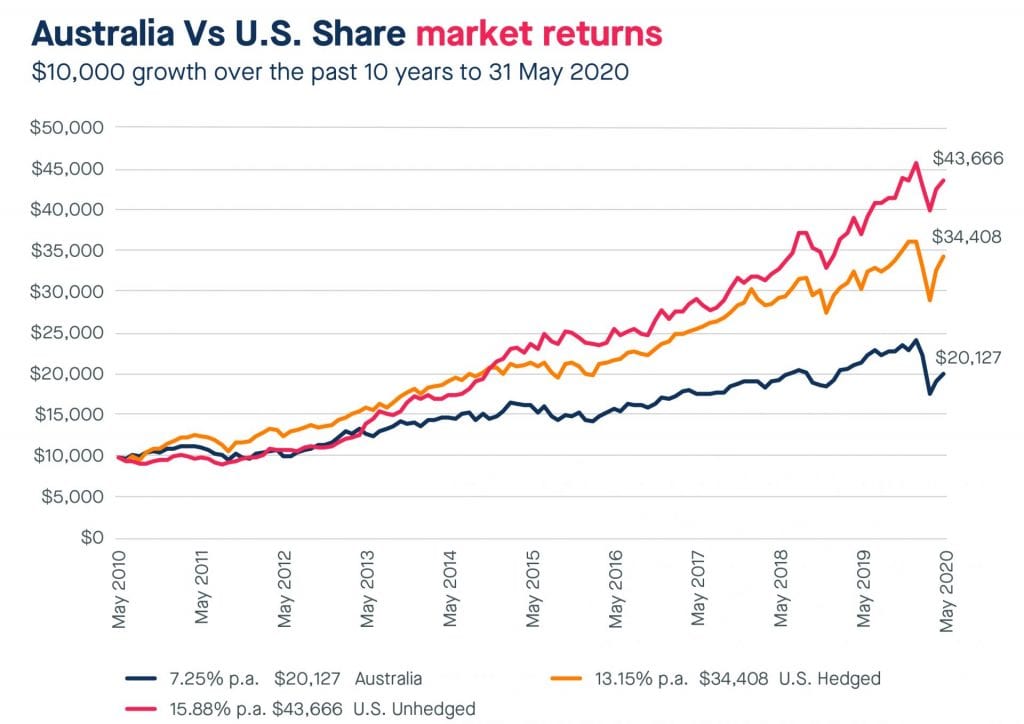
Source: IRESS. All returns shown assumes net dividends are reinvested. Returns are average annual per annum returns over the periods shown. Indices used are: Australian shares: S&P/ASX 200 Accumulation Index, U.S. Hedged: S&P500 Total Return Index, U.S Unhedged: S&P500 Total Return Index. Index performance does not take account of management costs, operational and transactional costs or tax. Index performance does not reflect the performance of any individual portfolio of stocks. Please remember past performance is not a guide to the future. Investments in overseas markets can be affected by currency exchange and this may affect the value of your investment.
To discuss the future of your investments in detail, book in a free consultation with a Lincoln representative.
To discuss the future of your investments in detail, book in a free consultation with a Lincoln financial expert.