There’s a long standing debate among Australian investors on whether property makes a better investment proposition than investing in stocks.
These are the two most popular asset classes and you’ll always find strong opinions about which option provides the best bang for your investment buck.
Which do you think delivers the higher return?
Analysing purely on a short-term basis, will naturally favour one option over another, depending which time period you choose. However, looking over the long-term, removes the volatility argument that pro-property investors often throw up as a reason to avoid investing in stocks.
On the face of it, investing in stocks can appear more volatile than property, a point that stock market believers have to concede. But, is this really the knockout blow for equities in this great debate? We don’t believe so.
If you subjected the property market to daily trading, like stocks, it too, would appear very volatile. So, let’s start comparing apples with apples. As there is no modelling tool to see property being traded like stocks, let’s look at stocks being treated like property over the long-term.
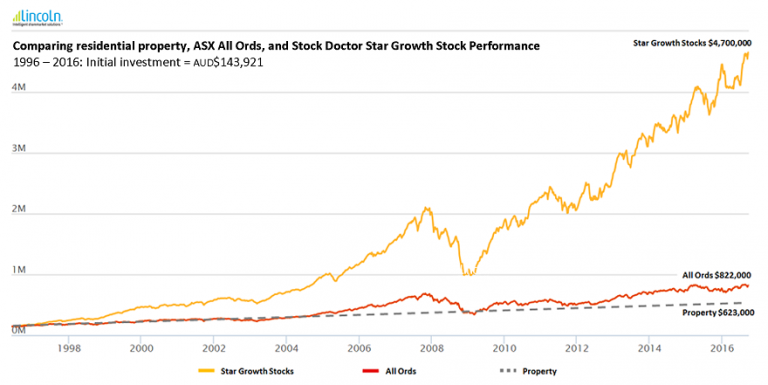
Looking at the last 20 years, enables a fairer representation of the results, and a more realistic comparison. According to ABS data, the median house price in Australia in 1996 was $143,921. In 2016 the median house price is now $623,000. An overall gain of 332% or $479,079. Not too shabby. I wonder what you’ve spent to maintain the property over that time? Let’s not complicate things for now, but that is definitely something to consider for the final figure.
Comparatively, if you had a portfolio made up of an average mix of ASX200 stocks, and it was worth $143,921 in 1996, today it’d be worth $822,000. Now that’s pretty good, a clear profit of $678,079, or 471%. And, I might add, the cost of maintaining this asset is virtually zero. Compared to typical costs of owning property, like stamp duty, council rates, body corporate fees, general maintenance and insurance, which are ongoing, and can run into the tens of thousands.
Let’s say in 1996, you invested $143,921 in a portfolio, made up purely of Stock Doctor Star Growth Stocks. Factoring in the GFC and other downward pressures, you’d still have a portfolio worth $4.7 million today.
Comparing right down to the minute detail of expenses like; rates and water charges, does seem a little petty now. Stock Doctor Star Growth Stocks performed 654.4% better than our hypothetical property investment, which in dollar terms, delivered $4,077,000 more than property over 20 years.
While every effort has been made to use real figures, this should not be interpreted as financial advice, and should be used for comparative purposes only. It’s intended to give a like-for-like comparison between the two investment choices that have historically dominated the Australian market.
And the proof…
Yes, there are many things to like about property investments. However, one that strikes me as particularly strange, is the obsession in having a tangible asset. The attraction to bricks and mortar is completely irrational, yet people often let it influence financial choices.
The fact remains, bricks and mortar are no more secure than stocks. The difference is, investing in stocks has a number of rational advantages over property. Particularly if you are just starting out on the investment path and have relatively modest capital at your disposal.
To wrap up the debate, the key points are:
1. Simple to invest: Investing in stocks is simple if you have the right tools to guide you. With the help of an investment platform like Stock Doctor, you can easily research, select and invest in a wide range of stocks that align with your objectives. Your returns will be governed by the fundamental quality to the companies you hold and your ability to remain disciplined in the management of your portfolio.
2. Your holding is liquid: You can sell the shares you want, when you want, without having to wait for long periods of time. If you need to sell your property, you need to outlay money to cash-in the asset, paying thousands to real estate agents just to manage the sale. Also, long sale processes, cooling off periods, settlement periods, result in your money being tied up for months at a time. With the stock market, you get your cash in a few days of selling your investment, and there’s no large sum due in order to cash-in your investment.
3. Easy access: To buy shares in any stock you simply need an online account and can trade from as little as $14.95 per trade. Property requires you to engage agents, conveyances and lawyers to make a transaction go through – and that means very steep transaction costs!
4. The ability to diversify: The stock market offers you the ability to diversify across sectors such as mining, health and even property through a real estate investment trust (REIT). With direct property you could invest across a range of sectors such as residential, commercial or industrial property. However, the cost of diversification would be exorbitant.
5. You don’t need debt to invest: Often the only way an investor can buy a property is if they take on a large amount of bank debt via a mortgage. This can put enormous strain on investors if they borrow outside their means. Investing in stocks requires a much lower outlay. A few hundred dollars will get you started.
6. Lower capital and cost requirements: As with any business, the owner will benefit when a company grows and increases its profits, making their investment more valuable. By investing in stocks, you can buy part of a business, or several businesses with a much smaller initial investment amount compared to purchasing an entire company. This gives you more flexibility to spread your investments across a range of companies.
With property, this is usually a very large, single investment. Meaning you’re putting all your eggs into one basket and the initial hurdle to get into the market is locking many Australians out.
7. Volatility is your friend. Remember this argument that’s often cited by property investors? Any seasoned share investor will tell you that volatility is indeed your friend. It is the vehicle that drives growth, through all the buying and selling and changing demand throughout all market conditions.
In turn, this fuels longer-term share market growth and puts money in your pocket. If you look at the long-term ASX performance you’ll notice, despite shorter-term blips, it’s always trending upwards. And, if you have a great tool like Stock Doctor, you’ll always be able to spot a bargain and boost your portfolio with good quality companies at a great price. Even during those blips!
We aren’t saying you should avoid property. But, we believe that if you only invest in one asset class, stocks are the standout choice. In our experience, investing in stocks provides the best opportunity for wealth accumulation over the long-term, with fewer risks, and stronger returns. I don’t know how a sound argument could be made in favour of property investing over stocks. By all means, try if you like.
^Disclosure – Star Growth Stock Past performance:
Star Growth Stock returns were calculated by Lincoln as a measure of the historical performance of the strategy reflecting the changes in recommendation and the performance of them over time and does not represent an actual investment. Investments go up and down. Past performance is not a reliable indicator of future performance and should not be relied upon.
The performance over the stated time period/s reflects the capital return and dividend income paid on a notional portfolio of $100,000 that is equally invested in each Star Growth Stock at the commencement of the relevant performance period quoted. The portfolio is rebalanced to equal weight exposure when the composition of the Star Growth Stocks changes.
For all transactions, closing prices for the next trading day are assumed. Transaction costs of 0.5% on each purchase and sale have been incorporated into the performance figure. Returns are expressed in a per-annum basis. The calculation makes no allowance for other distributions, government charges or tax, or annual subscription fees payable to Lincoln.
All performance figures are calculated as a per annum percentage and reflect the overall capital return and dividend income paid of the strategy highlighted above for the stated time period presented. It is important to note that for returns on periods longer than 12 months, actual annual returns achieved during the time period would have varied, both positively and negatively, from the stated overall performance figure. For returns of 12 months, the per annum performance varies positively and negatively month to month reflecting the volatility of the equities asset class. Therefore no performance figure should be taken as a reliable indicator of future performance.
The Star Growth Stock criterion has not remained constant but has been revised and updated over time. The quoted performance reflects actual Star Growth Stock recommendations as they have been published to the public over time and have not been retrospectively implemented.
performance period quoted.
^Disclosure – Star Stock Past performance: Star Stock (encompassing Star Growth, Star Income and Borderline Star Growth) returns were calculated by Lincoln as a measure of the historical performance of the strategy, reflecting the changes in recommendation and the performance of them over time and do not represent an actual investment. Investments go up and down. Past performance is not a reliable indicator of future performance and should not be relied upon.
The performance over the stated time period/s reflects the capital return and dividend income paid on a notional portfolio of $100,000 that is equally invested in each Star Stock category at the commencement of the relevant performance period quoted. The portfolio is rebalanced to equal weight exposure when the composition of the Star Stocks changes. Dividend distributions are reinvested in the specific investments which generate the distribution on the appropriate ex entitlement dates.
For all transactions, closing prices for the next trading day are assumed. Transaction costs of 0.5% on each purchase and sale have been incorporated into the performance figure. Returns are expressed on a per-annum basis, with the exception of time periods of less than 12 months where they are quoted as actual for the relevant period. The calculation makes no allowance for other distributions, government charges or tax, or annual subscription fees payable to Lincoln.
All performance figures are calculated as a per annum percentage and reflect the overall capital return and actual dividend income paid of the strategy highlighted above for the stated time period presented. It is important to note that for returns on periods longer than 12 months, actual annual returns achieved during the time period would have varied, both positively and negatively, from the stated overall performance figure. For returns of 12 months, the per annum performance varies positively and negatively month to month reflecting the volatility of the equities asset class. Therefore no performance figure should be taken as a reliable indicator of future performance.
The Star Stock criteria have not remained constant but have been revised and updated over time. The quoted performance reflects actual Star Stock recommendations as they have been published to the public over time and have not been retrospectively implemented.
Where we refer to the Lincoln Australian Growth Fund or Lincoln Australian Income Fund (the ‘Fund’), information and advice provided should be considered in conjunction with the Product Disclosure Statement (PDS) together with the Reference Guide of the Fund, which is available on request and from our website. This publication has been prepared to provide you with general information only. It is not intended to take the place of professional advice and you should not take action on specific issues in reliance on this information. Past performance should not be taken as an indicator of future performance. In preparing this information, we did not take into account the investment objectives, financial situation or particular needs of any particular person. You should read and consider the PDS and the Reference Guide before making any decision about whether to acquire or continue to hold the product. Responsible Entity/ Issuer of the Fund is Equity Trustees Limited ABN 46 004 031 298 AFSL 240975. Lincoln and its Authorised Representatives will be remunerated on the basis of monies invested in the Fund. You should read and consider our Financial Services Guide (FSG) provided to you, which sets out key information about the services we provide. The FSG is also available at www.lincolnindicators.com.au
To discuss the future of your investments in detail, book in a free consultation with a Lincoln representative.
To discuss the future of your investments in detail, book in a free consultation with a Lincoln financial expert.